Reading and Writing Intensity Values of a Image
Below is the block diagram using the same method to read image intensity values as before (see Converting an Image File to an Intensity Graph in LabVIEW), but it has been modified to write those values into a 1-D array in Excel.
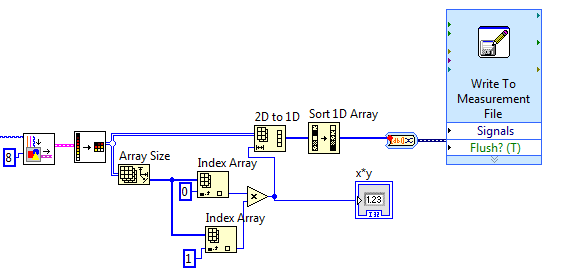
First, the size of the array must be known. To do this, we create an array using the Array Size VI. This creates an array with two values, the number of rows and the number of columns. Next, we index this created array to read the number of columns and rows. We then multiply the number of columns by the number of rows to get the size of the data set, which we can then use to set the size of the 2-D to 1-D array. The 1-D array is then sorted and written into an Excel spreadsheet.