Reading Data from Excel to Produce a Graph in labVIEW
Shown below is the block diagram

The Path block is just a constant file path defined by the user in the front end. In this case, the file is in comma-delimited format produced by excel.
Following the “wire”, we come upon the “Read Delimited Spreadsheet” VI, which can read delimited spreadsheets and create a 2D array out of them.
Next, the 2D array gets converted into a “columns are channels, rows are rows” format. This is needed so the “Build XY Graph” VI can read each array.
The converted array is put into either the x input or y input.
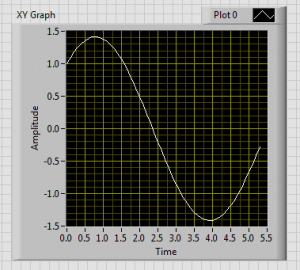
The output of this process is show below.