Creating a VI to Input Excel Files
To input an excel file a VI program needs to be created in LabView. The First thing that had to be created is two read delimited icons. One icon inputs x axis data while one will input y axis data on the graph. The purpose of these icons are that they are able to read 2d arrays of scalar numbers, which is essentially an excel file. The files that will be imported need to be convert to a comma delimited file. This is done so that the LabView program can read the data. After the icons are put in a constant of a comma needs to be attached so that the files can compatible with this build. The other portion of the program is an express VI which is called “Build XY graph”. We used an express VI since this type of VI has many applications for graphing different data and they are much more user friendly than regular VI’s. We use this VI since it takes our raw data from the icons and coverts it into a graph form. Finally an xy graph icon needs to be added so that the actual graph can be seen on the front diagram. An example of the graph can be seen below.
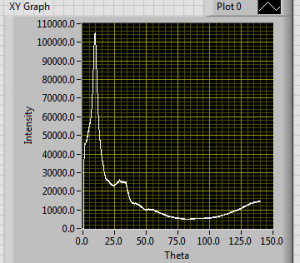
This is a graph intensity versus theta of an empty 2mm capillary.
To be able to change the properties of the graph, right click on the screen and then click properties. This window can change the axis titles, re-scale the graph, or it can change the appearance of the graph.

This is the image of the block diagram for the program. The two icons can be seen on the left. The constant is the pink box with the comma, while the icons are the boxes with the glasses and the array image inside. Using wire we connect each to either the x input or the y input. And finally it can be seen that the xy graph icon is attached to the express VI.