Monthly archives: May, 2017

Creating a VI that Inserts Data

http://digital.ni.com/public.nsf/allkb/02971A30F5D8FC6986256A0A004F11A0

This is a helpful link

To be able to insert a simple picture into labview only three functions need to be put in the block diagram.
The first is a read JPEG file icon. The purpose of this icon is that it converts the image files to data so that
it can be read by labview. The next icon that needs to be added is the Draw Flatten Pixel map. This takes the data
and actually creates it into a picture. The final item that is added is the picture icon. This is what actually
displays the picture onto the front panel.

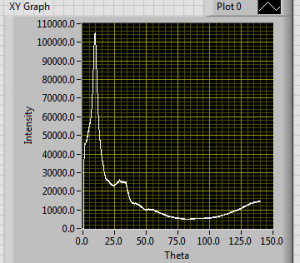
Then With Sven I built a program that can take an image file and import so that it is shown on an intensity screen.
The first icon needed was a file path. While again a read JPEG file icon and a Draw Flatten Pixel map is also
needed. Then the picture to pix map is included. This takes the picture and converts it into data so that many applications can be used with the picture. A constant needs to be added, this constant tells how many bit the pixel map will be. After this icon an unflatten pixmap icon is added. This is needed because the draw flatten pixel map flattens the data and this icon unflattens it. The last icon that is added is the intensity graph so that the image can be seen on the front panel.


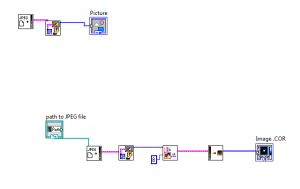
In the picture top program is to insert just an image, while the bottom program is to insert an image into an intensity graph.


Schedule for Summer Research

The following dates over the summer I will need off.

June 21-25

July 1-4

Thank you


Creating a VI to Input Excel Files

To input an excel file a VI program needs to be created in LabView. The First thing that had to be created is two read delimited icons. One icon inputs x axis data while one will input y axis data on the graph. The purpose of these icons are that they are able to read  2d arrays of scalar numbers, which is essentially an excel file. The files that will be imported need to be convert to a comma delimited file. This is done so that the LabView program can read the data. After the icons are put in a constant of a comma needs to be attached so that the files can compatible with this build. The other portion of the program is an express VI which is called “Build XY graph”. We used an express VI since this type of VI has many applications for graphing different data and they are much more user friendly than regular VI’s. We use this VI since it takes our raw data from the icons and coverts it into a graph form. Finally an xy graph icon needs to be added so that the actual graph can be seen on the front diagram. An example of the graph can be seen below.


graph for program to insert files

This is a graph intensity versus theta of an empty 2mm capillary.

To be able to change the properties of the graph, right click on the screen and then click properties. This window can change the axis titles, re-scale the graph, or it can change the appearance of the graph.

Program to insert excel files

This is the image of the block diagram for the program. The two icons can be seen on the left. The constant is the pink box with the comma, while the icons are the boxes with the glasses and the array image inside. Using wire we connect each to either the x input or the y input. And finally it can be seen that the xy graph icon is attached to the express VI.


Notes Starting Program and Imputing Data


Word pad over Start up procedure.

Start Up-Input Data


Observations of How Background Multiplier affects S(q)

Notes Over S(q) being changed by background Multiplier

——————————————————-

1. When the program is first started the background multiplier value is

Background = .304

Peak 1 intensity= 1.55
Peak 2 intensity= 1.8
Peak 3 intensity= 5.225
Peak 4 intensity= 3.14

Then we change the background values to see how the graph of s(q) changes.

Background 2= .1

Peak 1 intensity= 1.45
Peak 2 intensity= 1.7
Peak 3 intensity= 4.7575
Peak 4 intensity= 2.887

Background 3= .5

Peak 1 intensity= 1.625
Peak 2 intensity= 1.9375
Peak 3 intensity= 5.7625
Peak 4 intensity= 3.44
Background 4= .7

Peak 1 intensity= 1.75
Peak 2 intensity= 2.1075
Peak 3 intensity= 6.465
Peak 4 intensity= 3.825
Background 5= 1.5

Peak 1 intensity= 2.816
Peak 2 intensity= 3.621
Peak 3 intensity= 12.875
Peak 4 intensity= 7.325
Background 6= .9

Peak 1 intensity= 1.905
Peak 2 intensity= 2.327
Peak 3 intensity= 7.38
Peak 4 intensity= 4.327
Background 7= 1.1

Peak 1 intensity= 2.115
Peak 2 intensity= 2.62
Peak 3 intensity= 8.61
Peak 4 intensity= 5

Observations:

At a first glance it can be seen that when the background mult. is increased the intensity of the peaks will also increase.However after plotting the the data on the excel graph attached below we can also see that as the background mult. increases the relative peak separation in the y direction will also increase. After further analysis we noticed that there is a parabolic relation between peak heights when the multiplier is changed. We also found that there are constraints to the multiplier in which we can increase the multiplier until 2.123, but at that point the graph will become a line and any value
larger will make the graph be inverted. We observed for background mult. values of 0-2 the peaks will increase in intensity. While the Values between 2 and 2.123 will make the intensity values decrease until it is a line.
After taking and analyzing data I did not see any shift of the graph in the x direction. These values stayed constant no matter what the multiplier value was.
peak1= .867 q(1/A)
peak2= .909 q(1/A)
peak3= 1.229 q(1/A)
peak4= 1.474 q(1/A)
The Background mult. is a multiplier on the intensity of the dark empty chamber before it is subtracted from the detector image.The background needs to be subtracted so that when we do our final analysis our data will not include the Dark images or the container. This is considered to be a correction to our data.


Excel Graph of Data

Background Data


Back Ground Multiplier edit

Above is a picture of the graph of S(q) The background mult. is labeled and so are peaks 1-4.